Weather Gurus - Analysis on Global Temperature Anomalies
INFO 523 - Spring 2023 - Project 1
Introduction
The dataset contains four CSV files, providing temperature anomalies across different spatial and temporal scales for a long period from 1880 to 2022. We’ll analyze yearly temperature anomalies datasets to assess global and hemispheric trends.
Additionally, we’ll focus on seasonal anomalies, examining for the Northern Hemisphere and their inverted counterparts for the Southern Hemisphere.
Question 1: Analysis on Zonal Temperature Anomalies
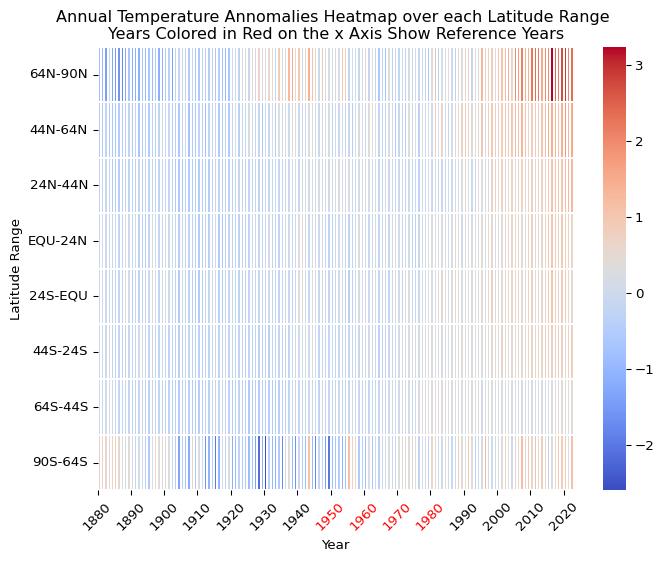
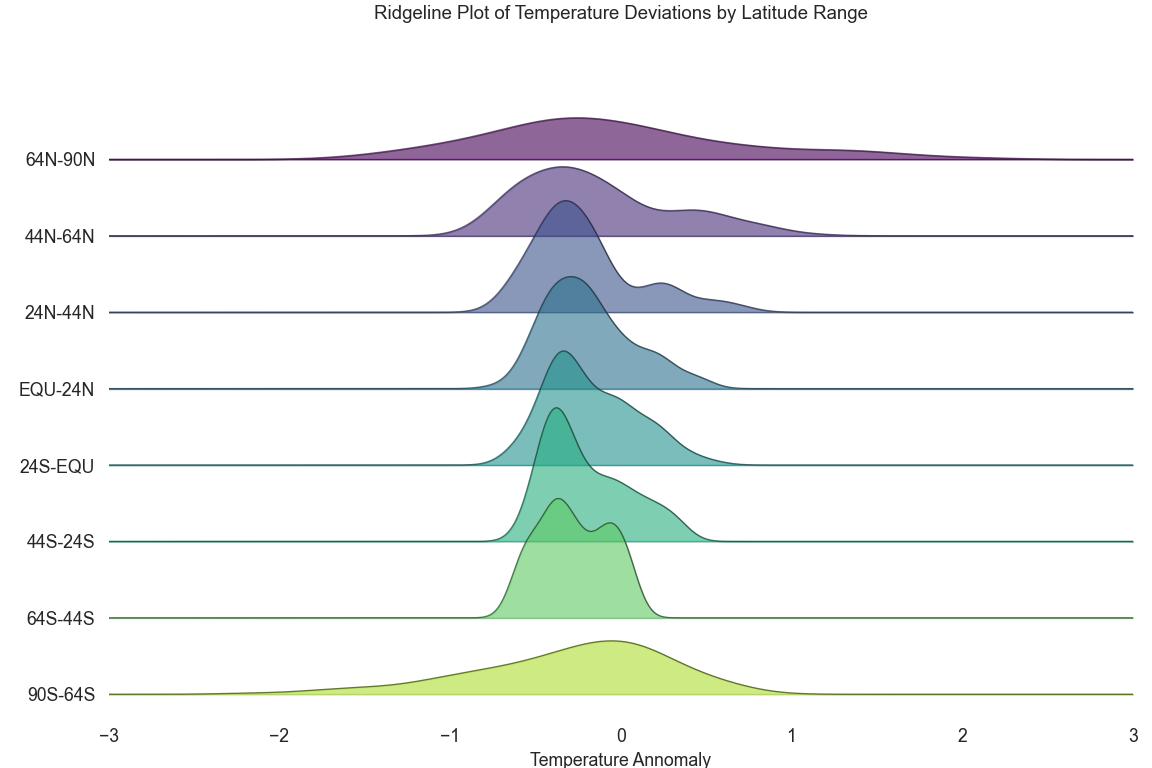
We analysed the temperature anomalies across the latitudinal zones of earth. The approach involved two distinct methods:
- Heatmap Visualizaton
- Ridge Plot Visualization
Heat Map
Ridge Plot
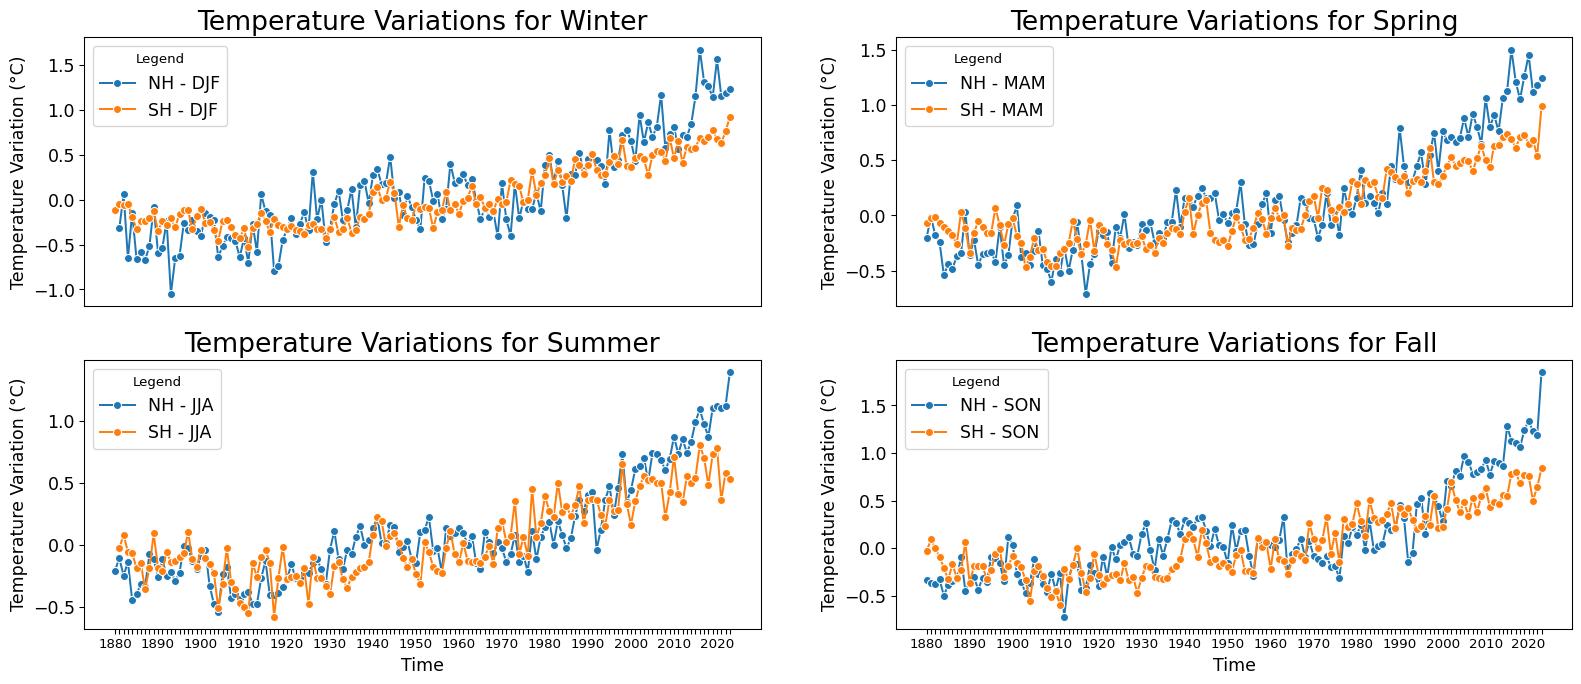
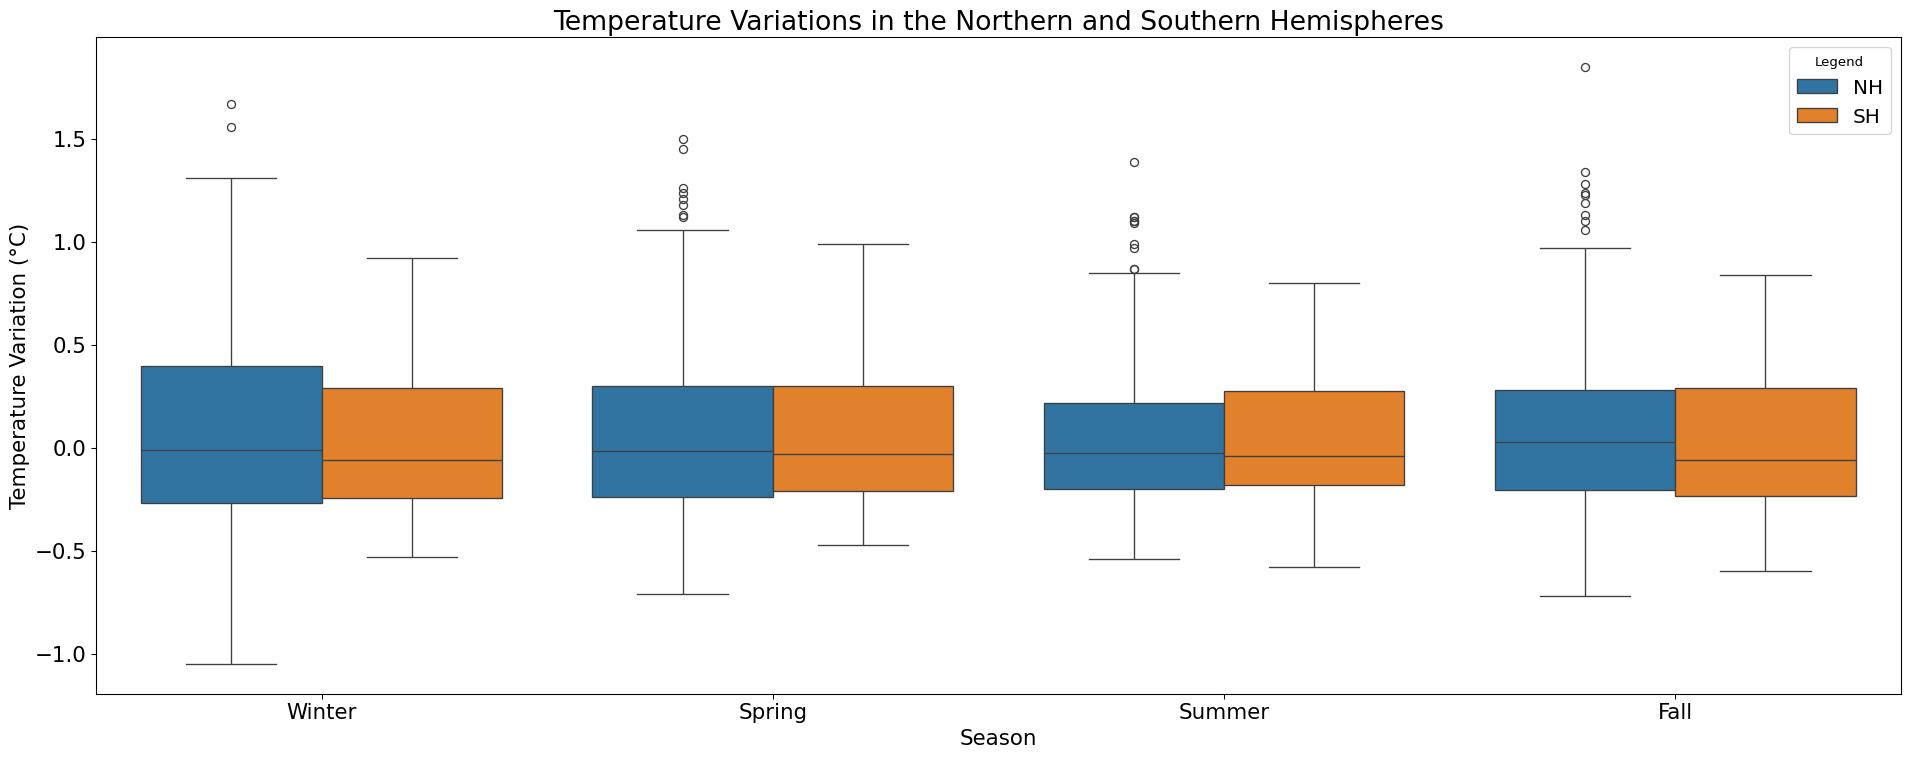
Question 2: Analysis on Seasonal Temperature Anomalies
We compared the pattern of seasonal temperature anomalies over the Northern and Southern hemispheres separately and collectively. For this, we used:
- Time Series Analysis
- Box Plot Visualization
Time Series Analysis - Line plot
Boxplot
Conclusion
In conclusion, the proposed analysis of global surface temperature anomalies offers valuable insights into understanding climate change trends and their impacts on various regions.
Through visualizations and analysis, the project seeks to inform strategic planning and adaptation measures to mitigate the adverse effects of climate change on human livelihoods and ecosystems.
This endeavour underscores the importance of interdisciplinary collaboration and data-driven approaches in addressing the challenges posed by climate change.