Global Energy Trends
INFO 523 - Spring 2023 - Project Final
Ayesha, Abhishek, Shreemithra, Toluwanimi, Valerie, Alyssa
Project Overview and Data set
Energy is crucial today for powering industries, homes, and technological advancements.
The aim of this project is to predict power consumption trends based on population size, GDP, renewable energy usage, and identify regions transitioning to sustainable energy practices while reducing greenhouse gas emissions.
This data set was gathered from the Our World in Data website where multiple data sets were merged together to form this data.
Question 1
Is it possible to predict a nation’s power consumption by considering its population size, gross domestic product (GDP), and the percentage of electricity generated from renewable sources and changes across the years?

Next steps
Visualizations
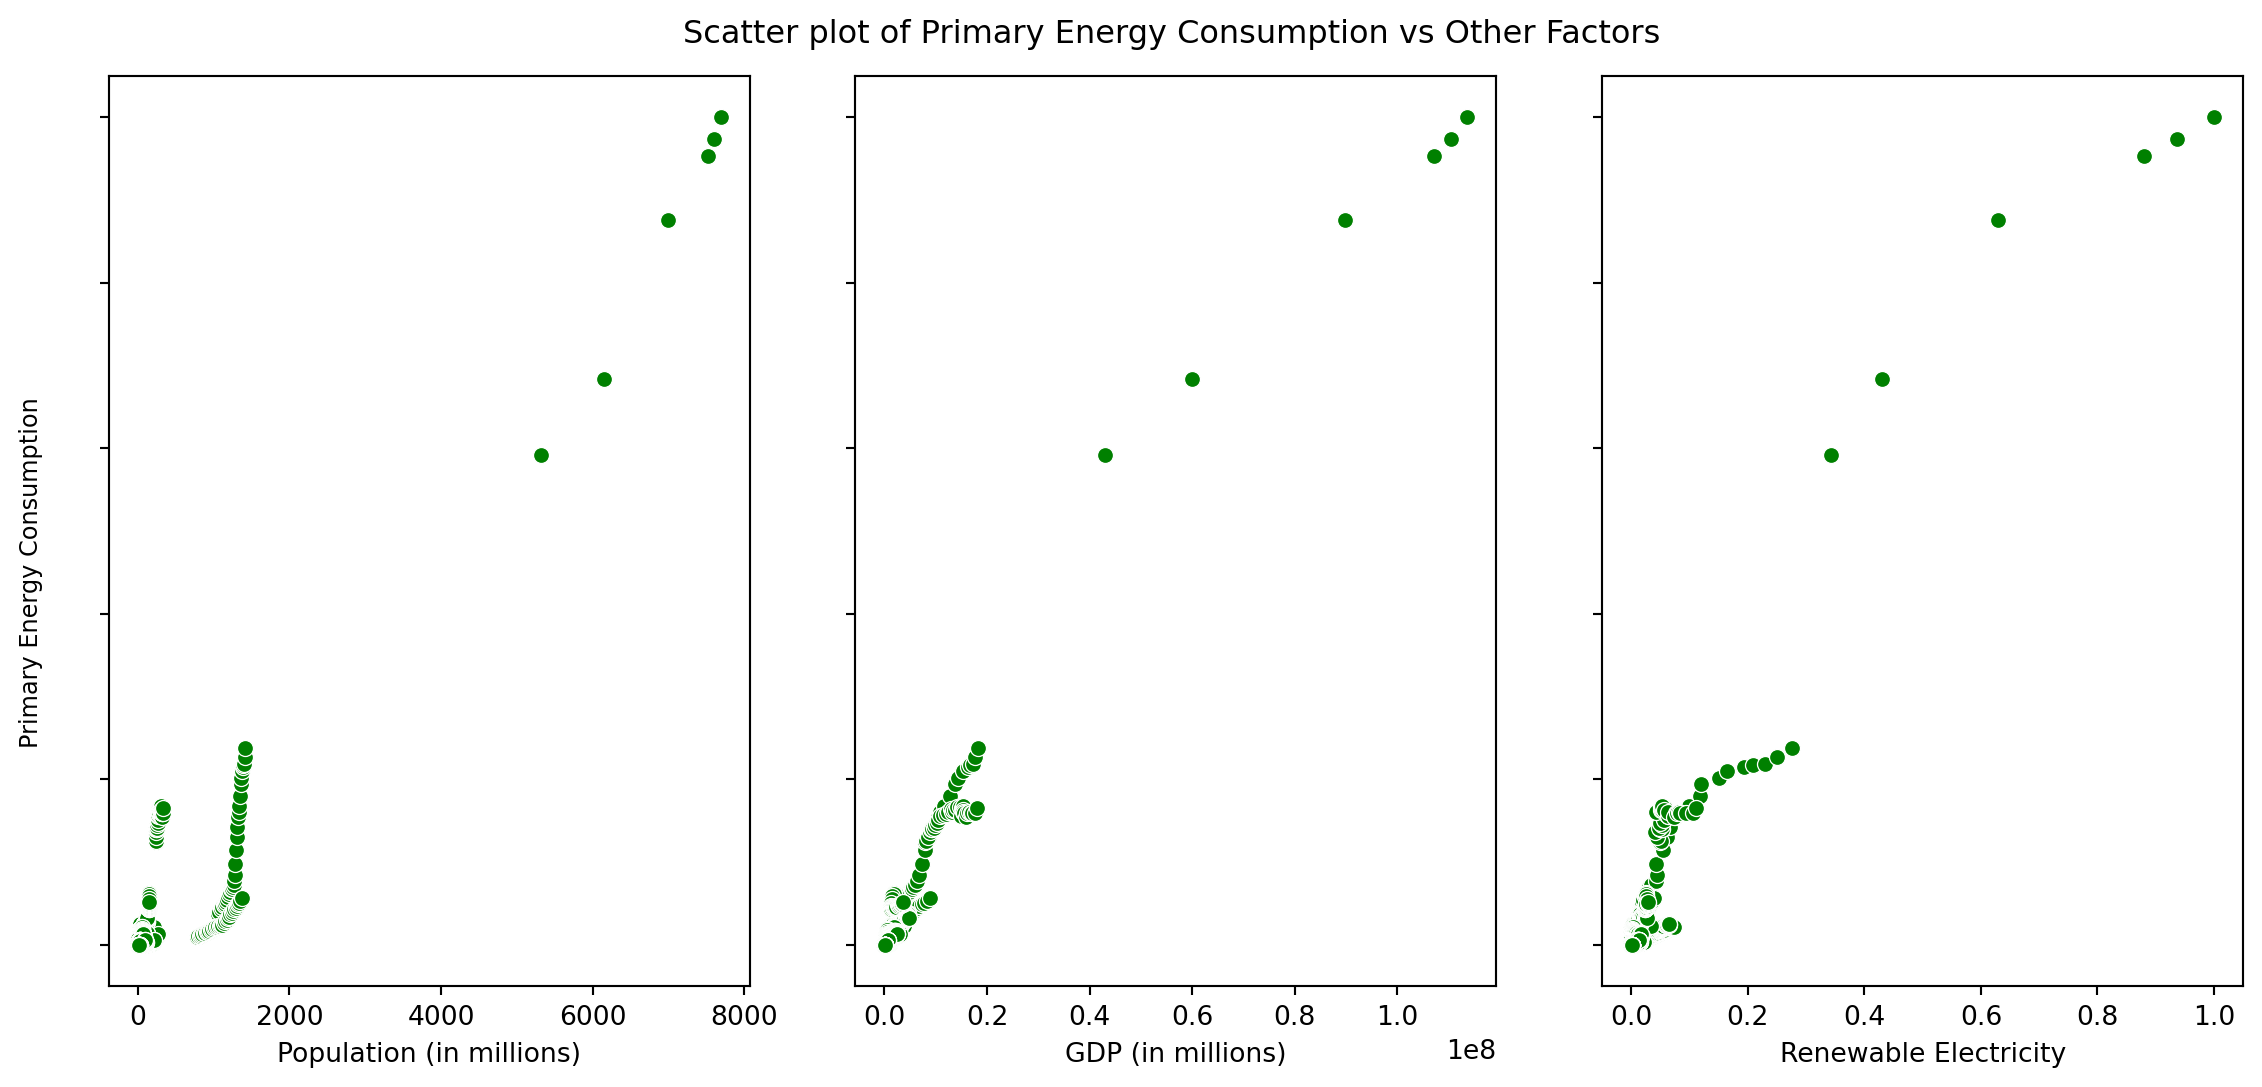
populationandgdpare directly linked to energy demand.
renewables_electricity/electricity_generationare used to create a percentage.
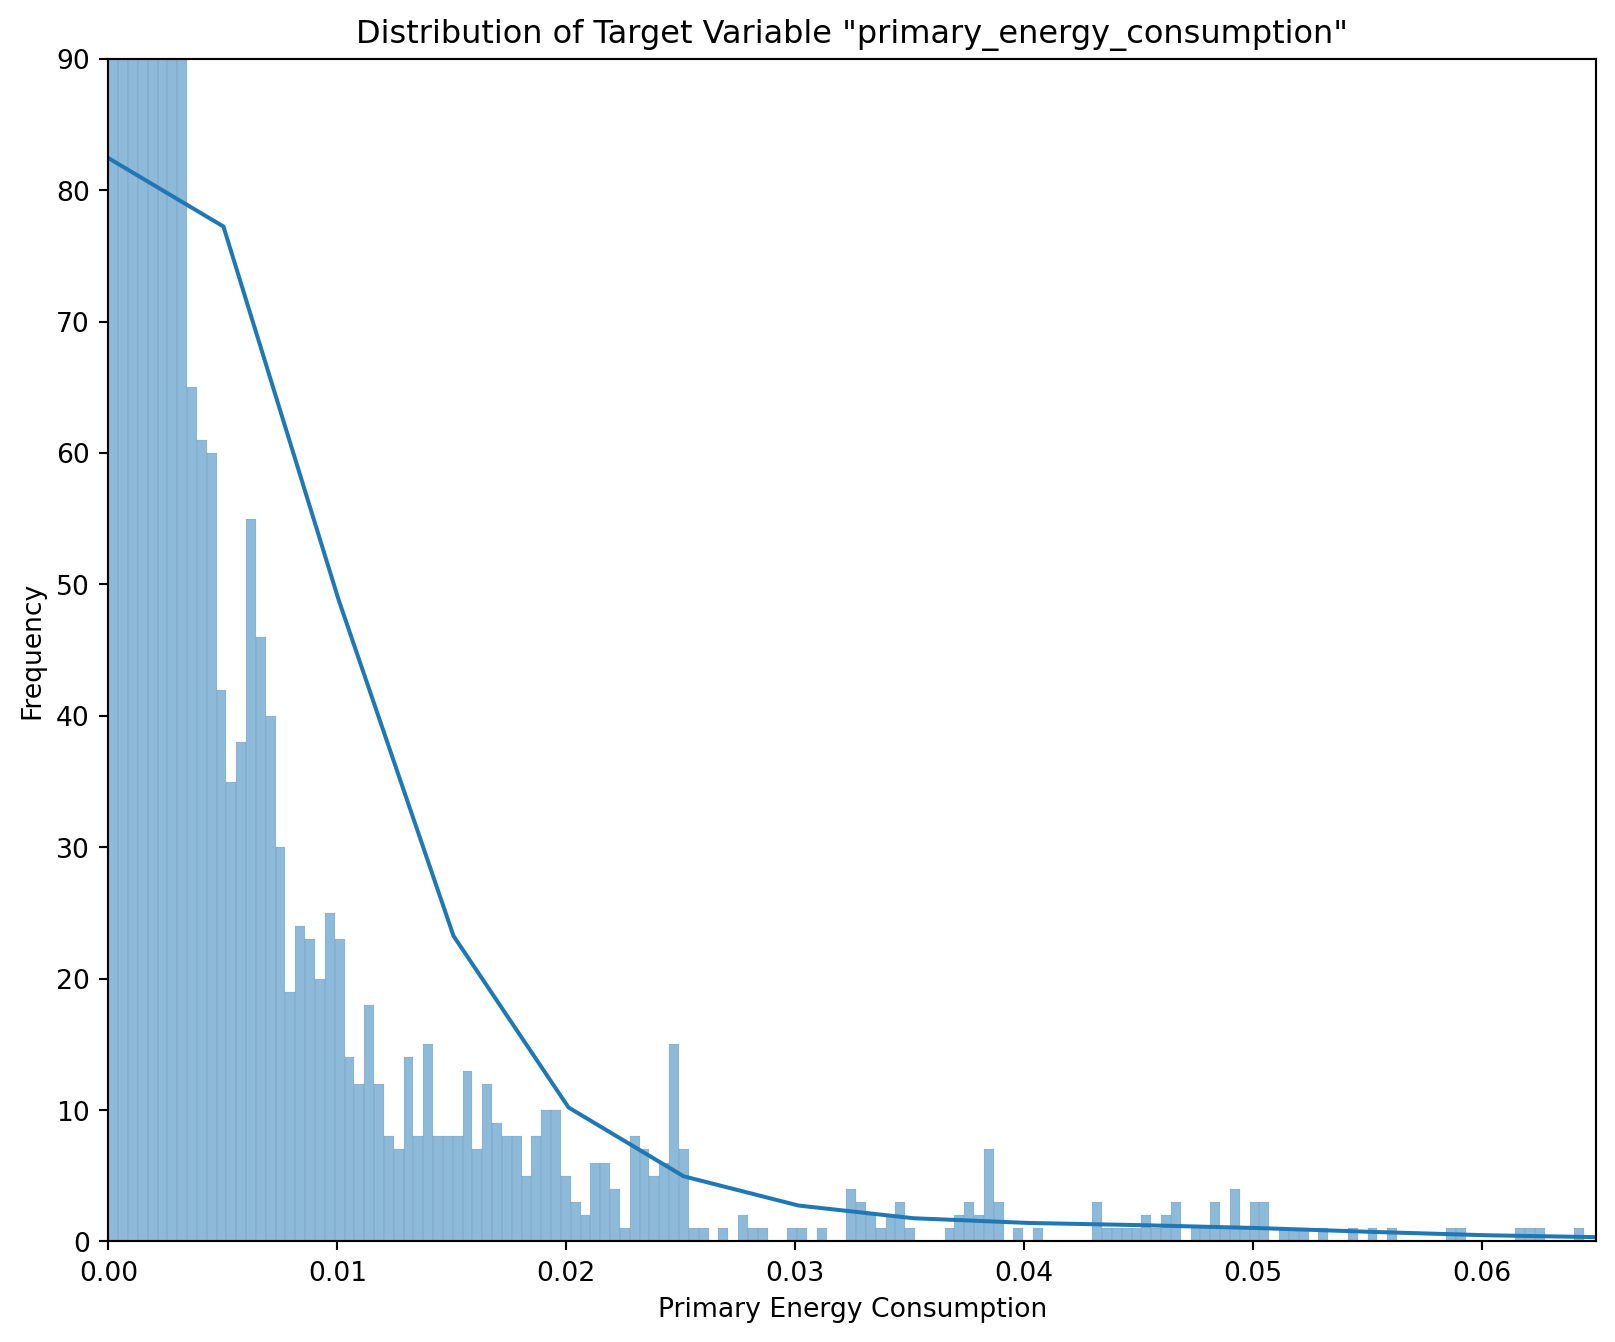
primary_energy_consumptionis the target variable.
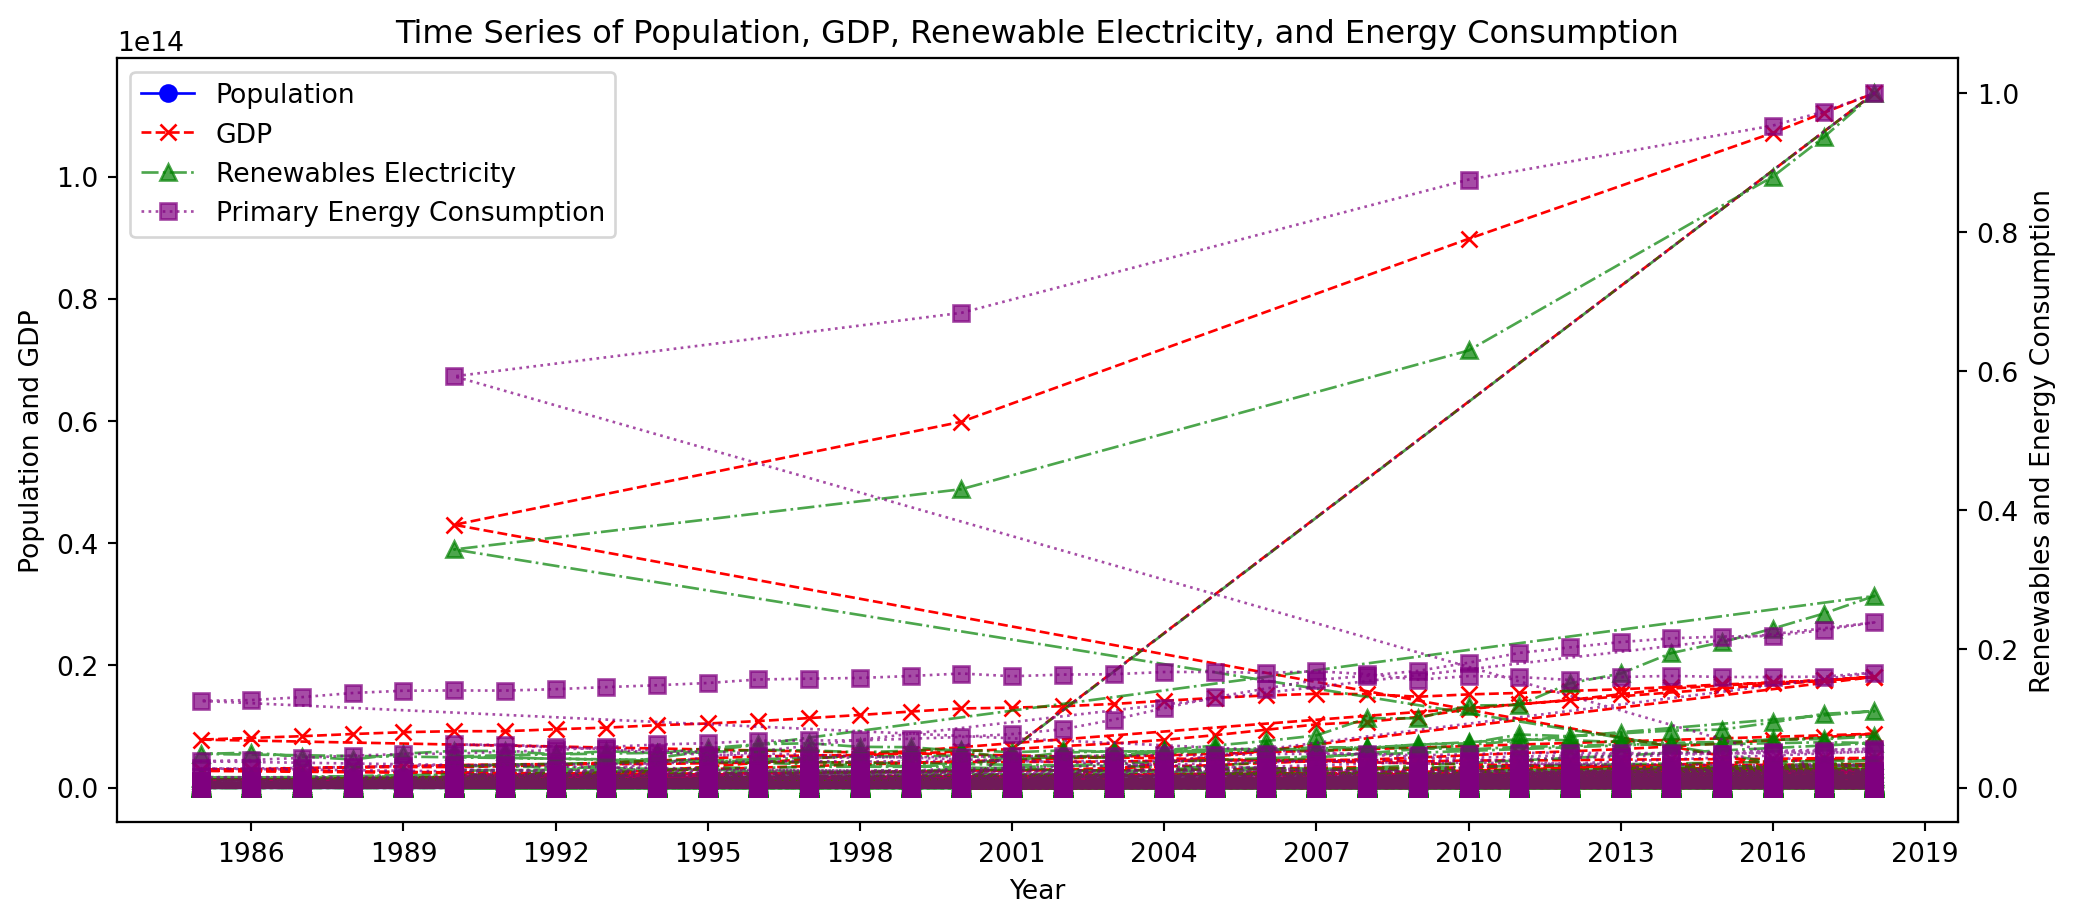
yearis used to perfrom time series analysis.
- Cleaning and manipulating the dataset.
- Using descriptive statistics to create distribution plots.
- Performing correlation analysis to visualize scatterplots.
- Creating a time series analysis plot by observing the change of selected columns over time.
Distribution Plot
Scatter Plot
Time Series Analysis Plot
Question 2
What countries or regions are engaging in sustainable energy practices and relying more on renewable energy compared to nonrenewable energy? Which countries are moving towards the trajectory of relying more on renewable energy and producing less greenhouse gas emissions?
![]()
Next steps
- For insights into trends in renewable energy share and practices: Solar_consumption, Wind_consumption, Hydro_consumption, Other_renewable_consumption, Renewable_energy_share, Greenhouse_gas_emissions, Renewables_electricity, Electricity_generation, and Year.
- For clustering analysis: Country, Year, Population, GDP, and all energy-related columns.
- A map and bar plot were utilized to reveal renewable energy consumption and greenhouse gas emissions.
- A line plot was used to display trends in global energy consumption.
- A density plot illustrated renewable energy and non-renewable energy consumption by continent.
- Clustering analysis was conducted on energy-related variables to identify clusters for regional boundaries based on their renewable and non-renewable energy consumption patterns.
MAP:Share of Renewable Energy Consumption
Insights
This visualization reveals the share of renewable energy around the world.
North America has very little to adequate amount in the share of renewable energy.
South America has little share of renewable energy for some parts while some other parts have a large share of renewable energy.
Some parts of Asia also have the same renewable energy share distribution as North America with some parts having more and some having very little.
Barplot 1
Barplot 2
This plot reveals the top 10 countries with mean green house emissions.
Countries such as China and the United states have the highest green house emissions out amongst the top 10 countries.
This is followed by INdian, Japan, Russia, Germany, South Korea, South Africa, Australia, and the United Kingdom.
Line plot
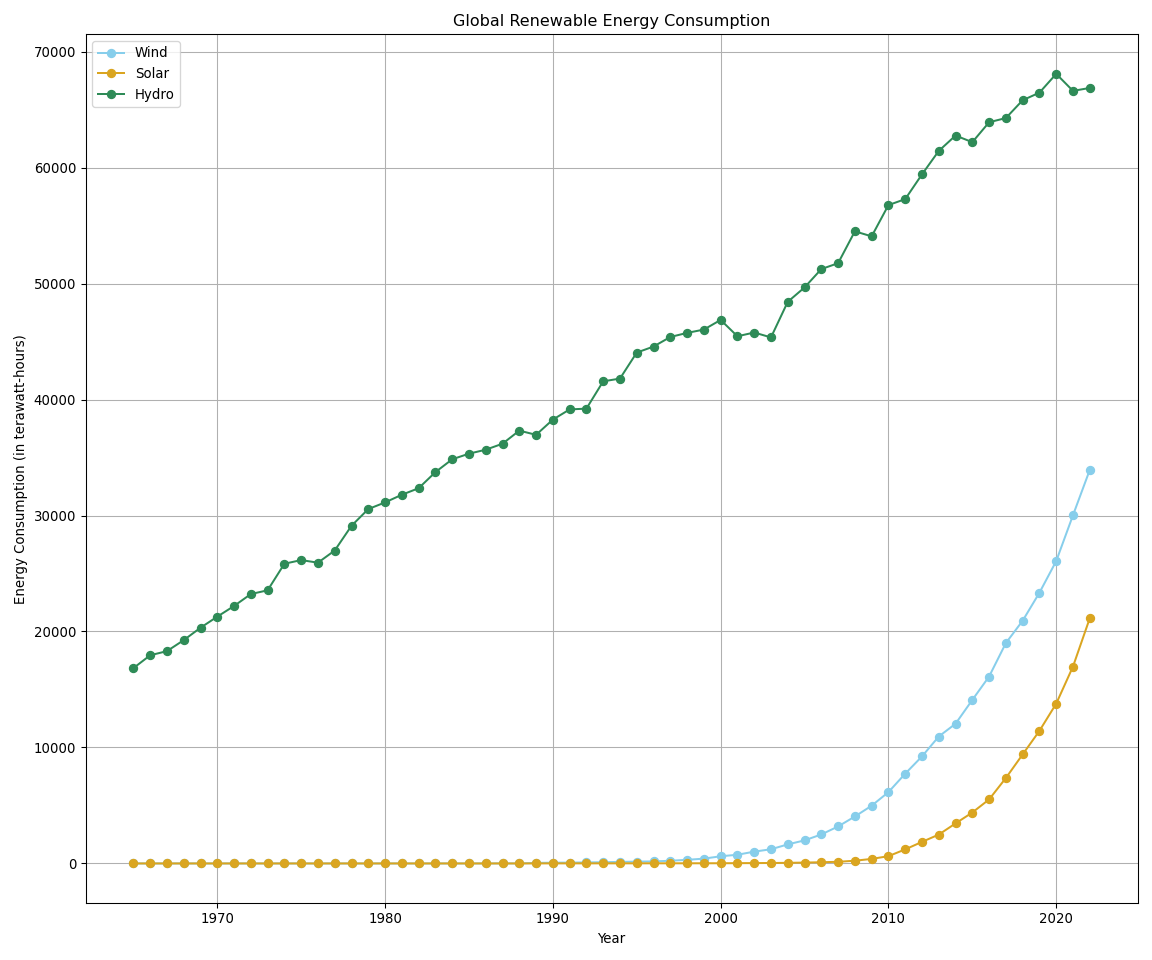
Insights
This visualization provides information on the energy consumption of wind, solar, and hydro energy over the years.
This plot reveals that Hydro electric power has always been in the lead in terms of energy consumed over the years. Its consumption seems to have climbed steadily over the years.
Wind and Solar Energy consumption seems to have taken off in the early 2000s and have continued to climb steadilty over the years with more of wind energy being consumed than solar energy.
Density plots
Renewable Energy Consumption
Non-Renewable Energy Consumption
Insights
This plot reveals that South America are the leading continents in terms of renewable energy conosumption.
Africa has a very steep density curve implying that its consumption of renewable energy has barely grown over the years.
This plot reveals that Europe is one of the largest consumers of non-renewable energy.
Asia has also had its consumption of non-renewable energy grow by large amounts over the years.
Clustering Plots
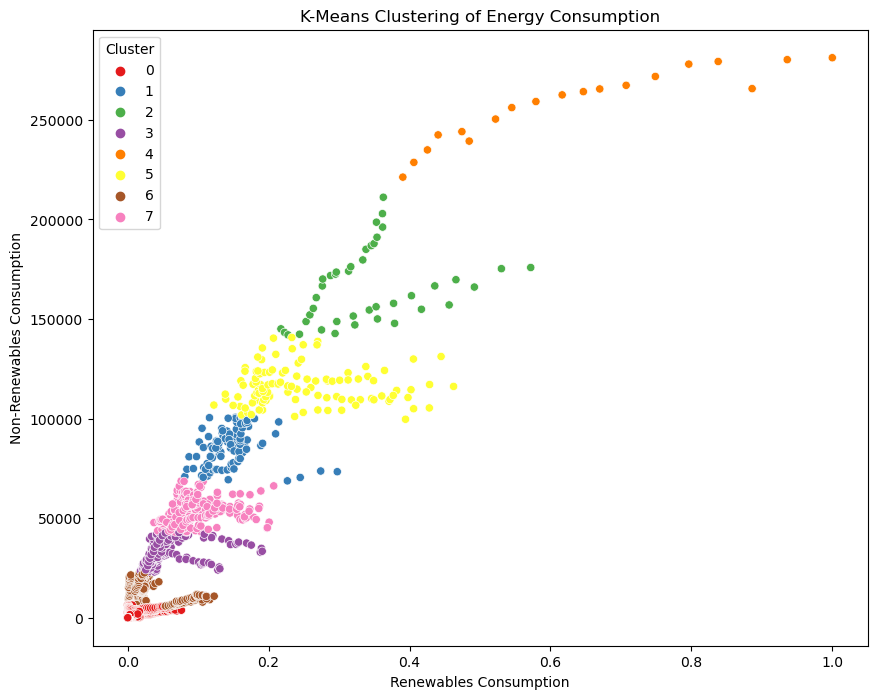
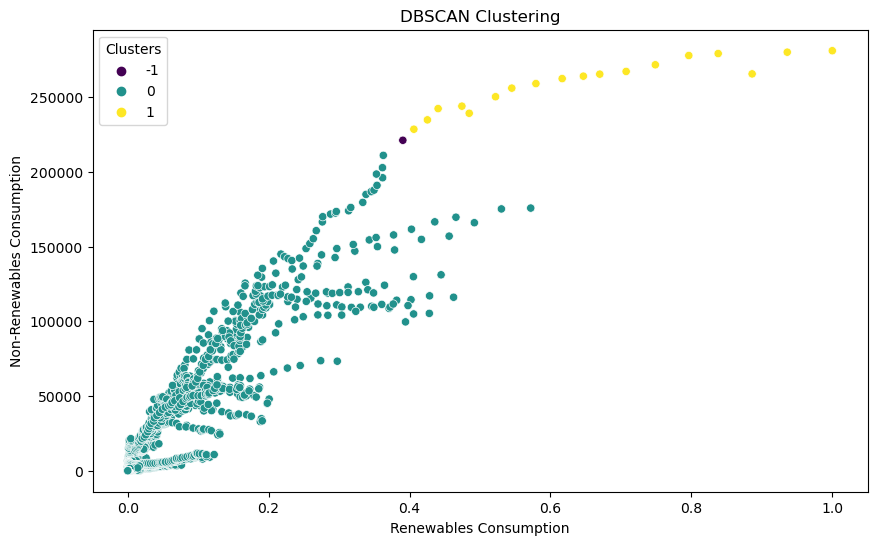
Insights
This cluster analysis resulted in 8 clusters when the K-Means was used.
After the DBSCAN was conducted, 2 clusters emerged while one remained an outlier.
A silhoutte score was calculated to determine the accuracy of this cluster which yielded a score of 0.96.
This implies that the cluster method developed here was very effective.
Conclusion
- Economic and demographic growth often coincide with increased energy demand, while shifts in renewable energy proportion suggest changes in energy source composition. Analyzing these patterns aids in forecasting future power consumption trends.
- Nations like China, India, Brazil, and the USA are at the forefront of renewable energy adoption, yet persistent greenhouse gas emissions in some countries necessitate intensified emission reduction endeavors.
- Continental Dynamics: While there’s a global upsurge in renewable energy utilization, simultaneous spikes in non-renewable consumption highlight the ongoing imperative for sustainable energy transitions.
- Clustering techniques unveil regions preferring renewable energy over non-renewable sources, offering crucial insights for targeted sustainability strategies.
References